Latest physical activity data released
29/06/2020
Latest physical activity data released for Greater Manchester’s boroughs
Following the latest (November 18-19) Sport England Active Lives data, released in April, we have now received and analysed the data at both a Greater Manchester (GM) and borough level to understand the key differences that exist between different demographics.
Since the survey launched in November 15-16, the active population (those who do 150+ minutes of physical activity a week), has increased by 2.6%, this is more than double the national increase of 1.2%. As a whole 73.8% of adults in GM are moving (active and fairly active), however, this level varies significantly across the 10 boroughs of GM; there is a 9.7% activity gap between Bury and Oldham, the boroughs with the highest and lowest physical activity levels.
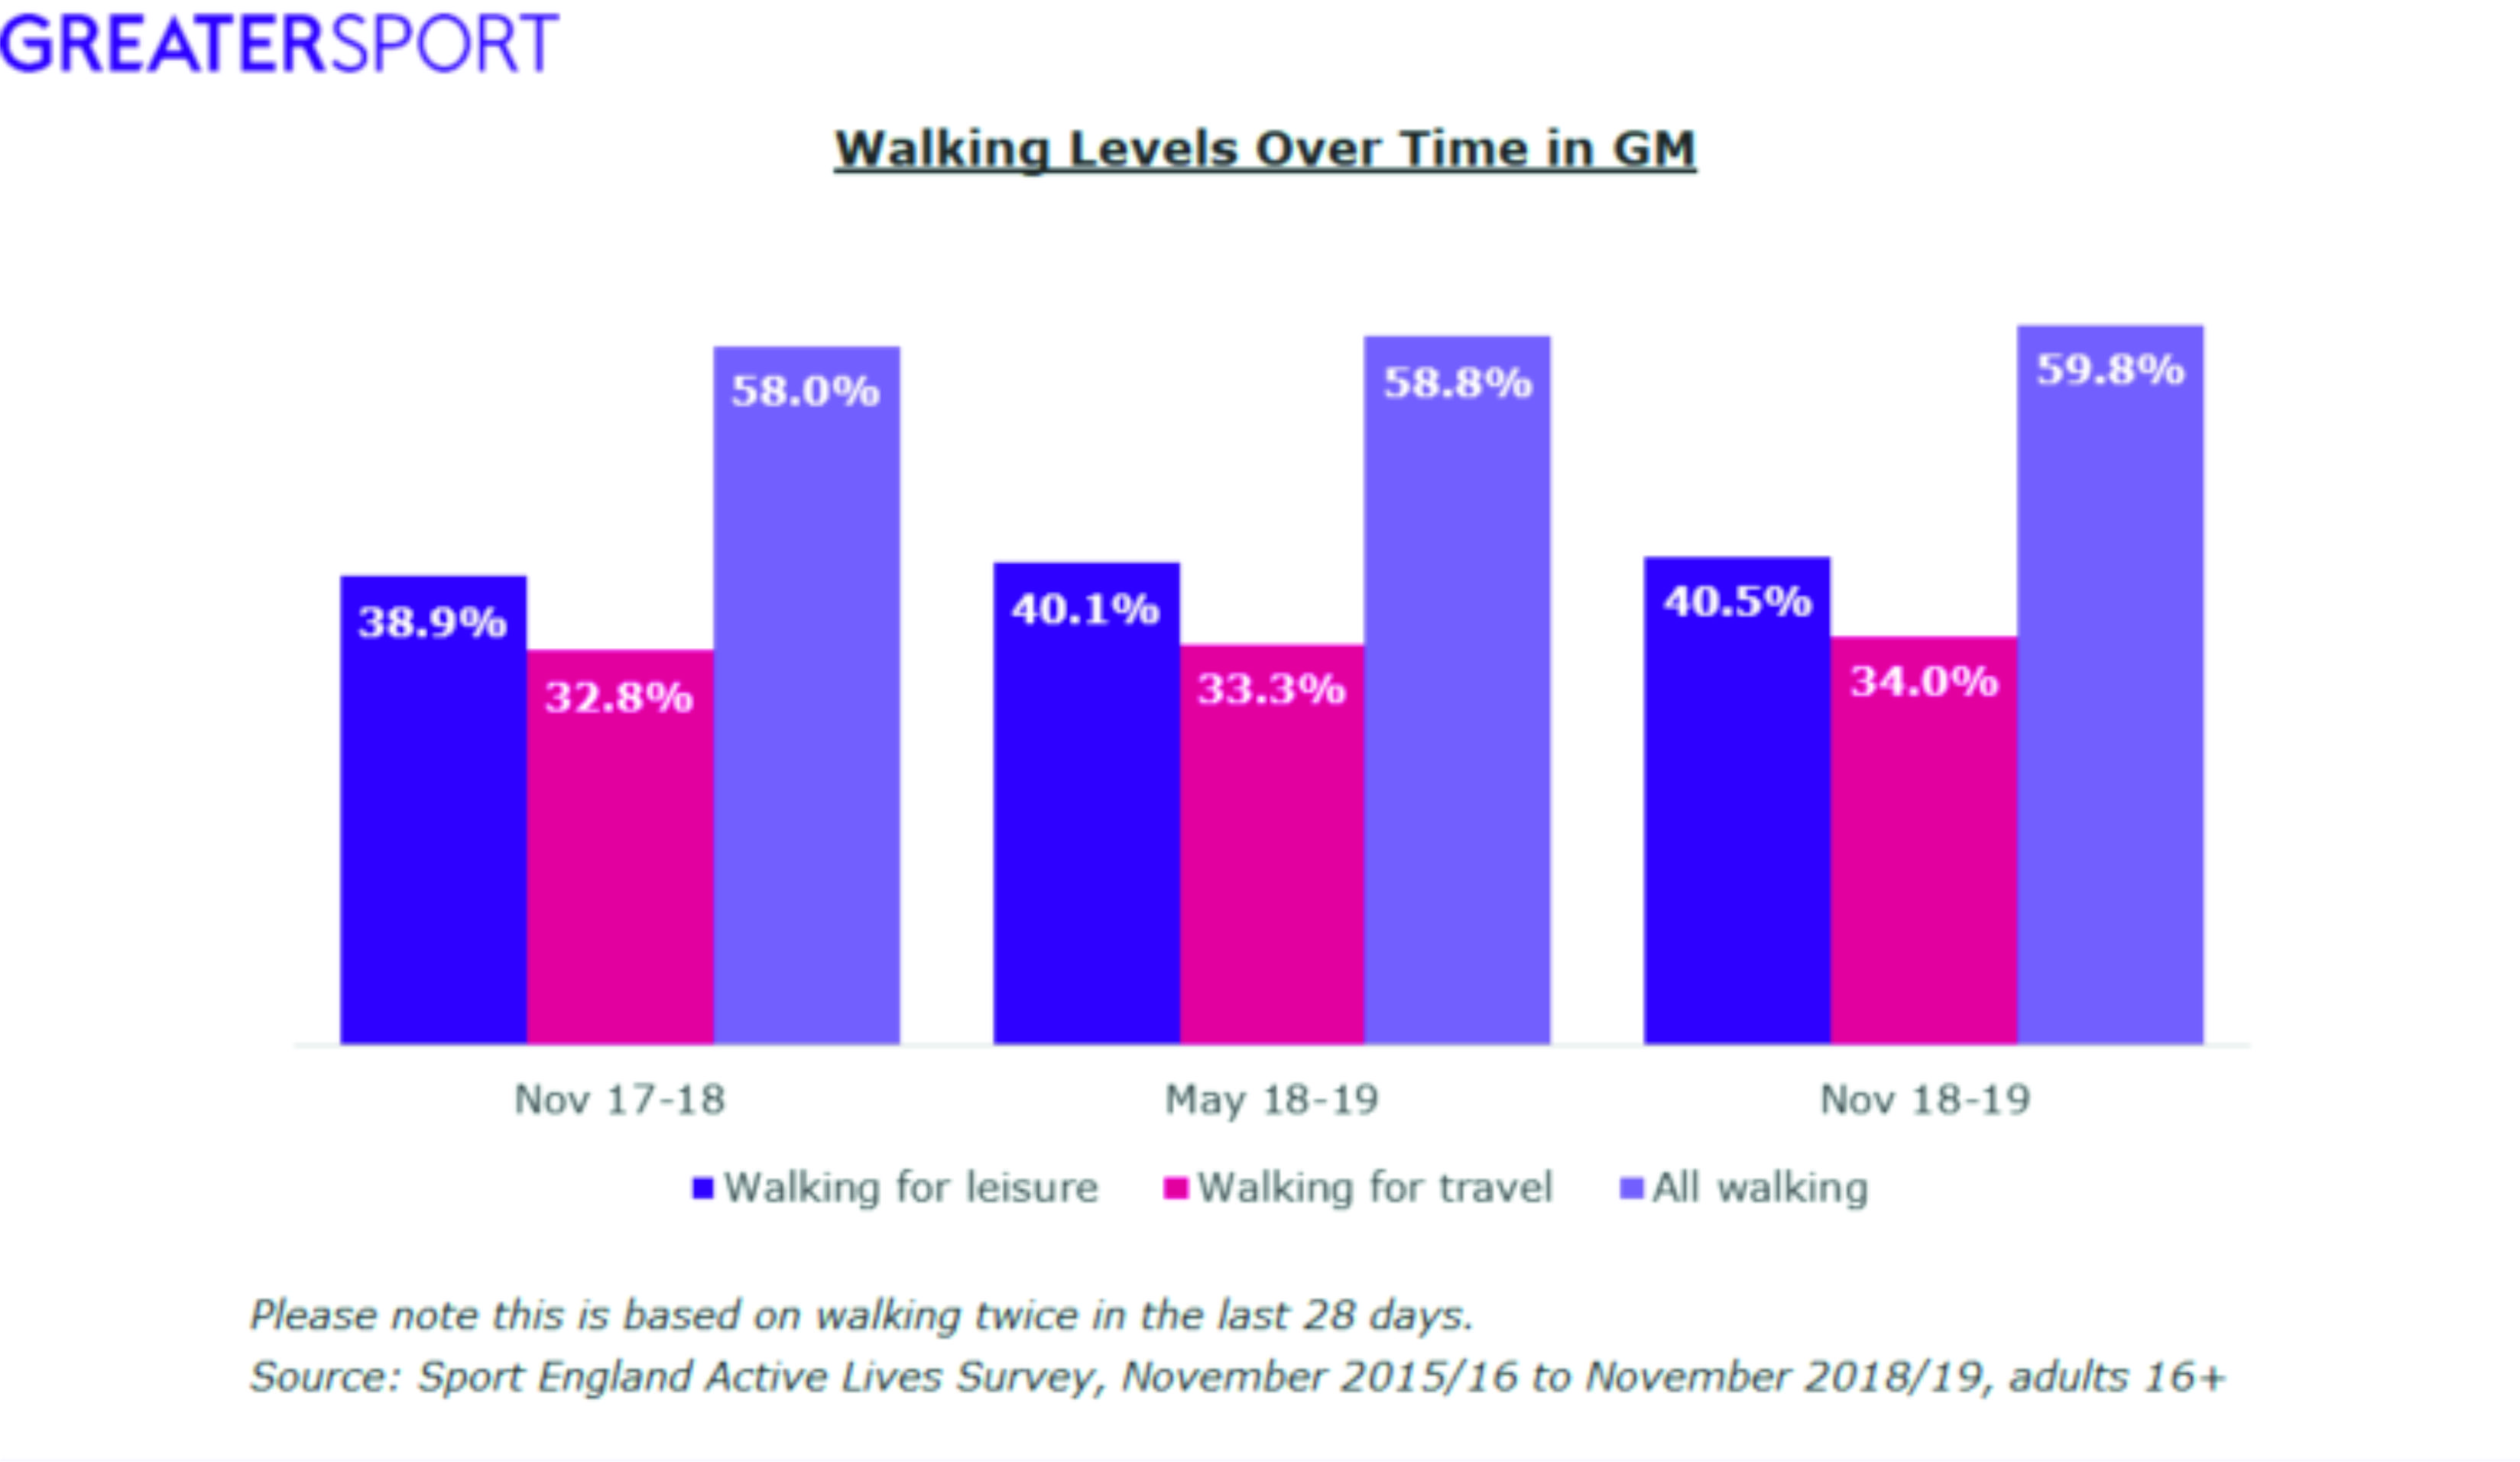
Overall in GM walking for travel has increased by 1.2% since Nov 17/18. Walking for leisure remained the same and all walking has increased by 1.8%. (Based upon walking of a moderate intensity for at least 10 minutes.)
This equates to 1,337,000 adults(16+) in GM walking (all walking) at least twice in the last 28 days.
Greater Manchester Overview
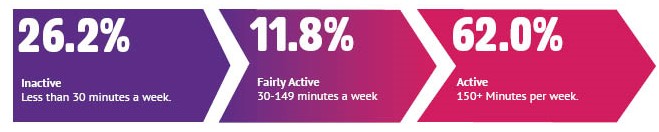
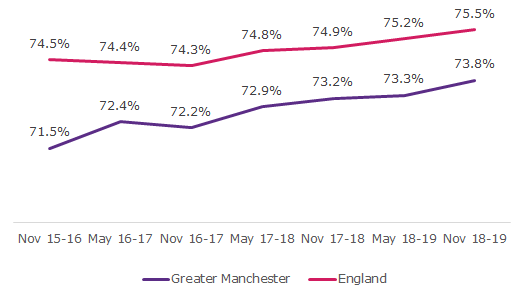
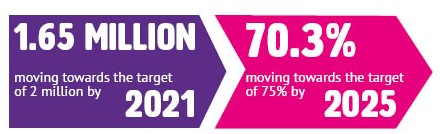
The latest results continue the positive trend in activity levels for Greater Manchester. The region has now reached 73.8% of the adult population moving (active and fairly active), this equates to 1,649,900 adults. Since the first Active Lives release, November 15-16, there has been an increase of 2.6% of the adult population moving, this is more than double the national increase of 1.0%. However, despite the strong growth in Greater Manchester the proportion of people moving is still below the national average of 75.5%.
Greater Manchester Moving Population Compared to England Over Time
When this latest release is combined with activity data on children and young people, our progress towards our two key targets is clear.
Find out more about activity levels of children and young people in Greater Manchester here.
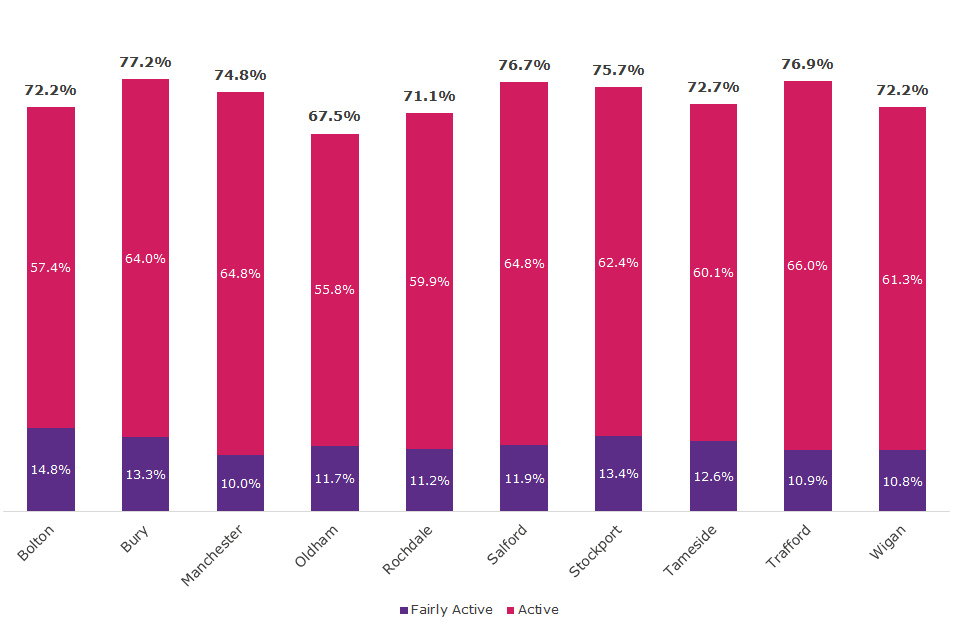
There also remains clear differences between the boroughs; there is a difference of 9.7% between the most active borough, Bury, and the least active, Oldham.
Borough Moving Levels
It is particularly promising to see the progress being made in tackling inequalities across the city region. There are reductions in the gender (-0.6%), disability (-1.3%), socio-economic (-3.1%) and age (-8.2%) gaps with the two latter activity gaps now being smaller than the national figures.
These are promising steps forwards in reducing the inequalities in physical activity levels across GM, however, there is still more to be done; the gender and disability gaps both remain larger than the national figures and are closing at a slower rate. This is particularly pronounced with the disability gap, which is decreasing over two times faster nationally than it is in GM.
At a borough level, the majority of boroughs are also showing reduced activity gaps;
- Seven of ten have reduced the gender gap.
- Six of ten have reduced the disability gap.
- Five of eight have reduced the socio-economic gap.*
- Six of eight have reduced the age gap.*
*Some areas did not have enough responses for certain demographics at either baseline or in the latest release, this means that the inactivity gap change over this time period can’t be calculated.